Bose Acoustical Modeling
Leading UX and a design system for the software that models how sound covers a room, built with some of the best sound designers in the world.
I led a team of UX designers, working closely with some of the best sound designers in the world to disrupt live and installed acoustical data modeling. The goal was to make how sound covers a room something you could see and trust at a glance, not read out of a table.
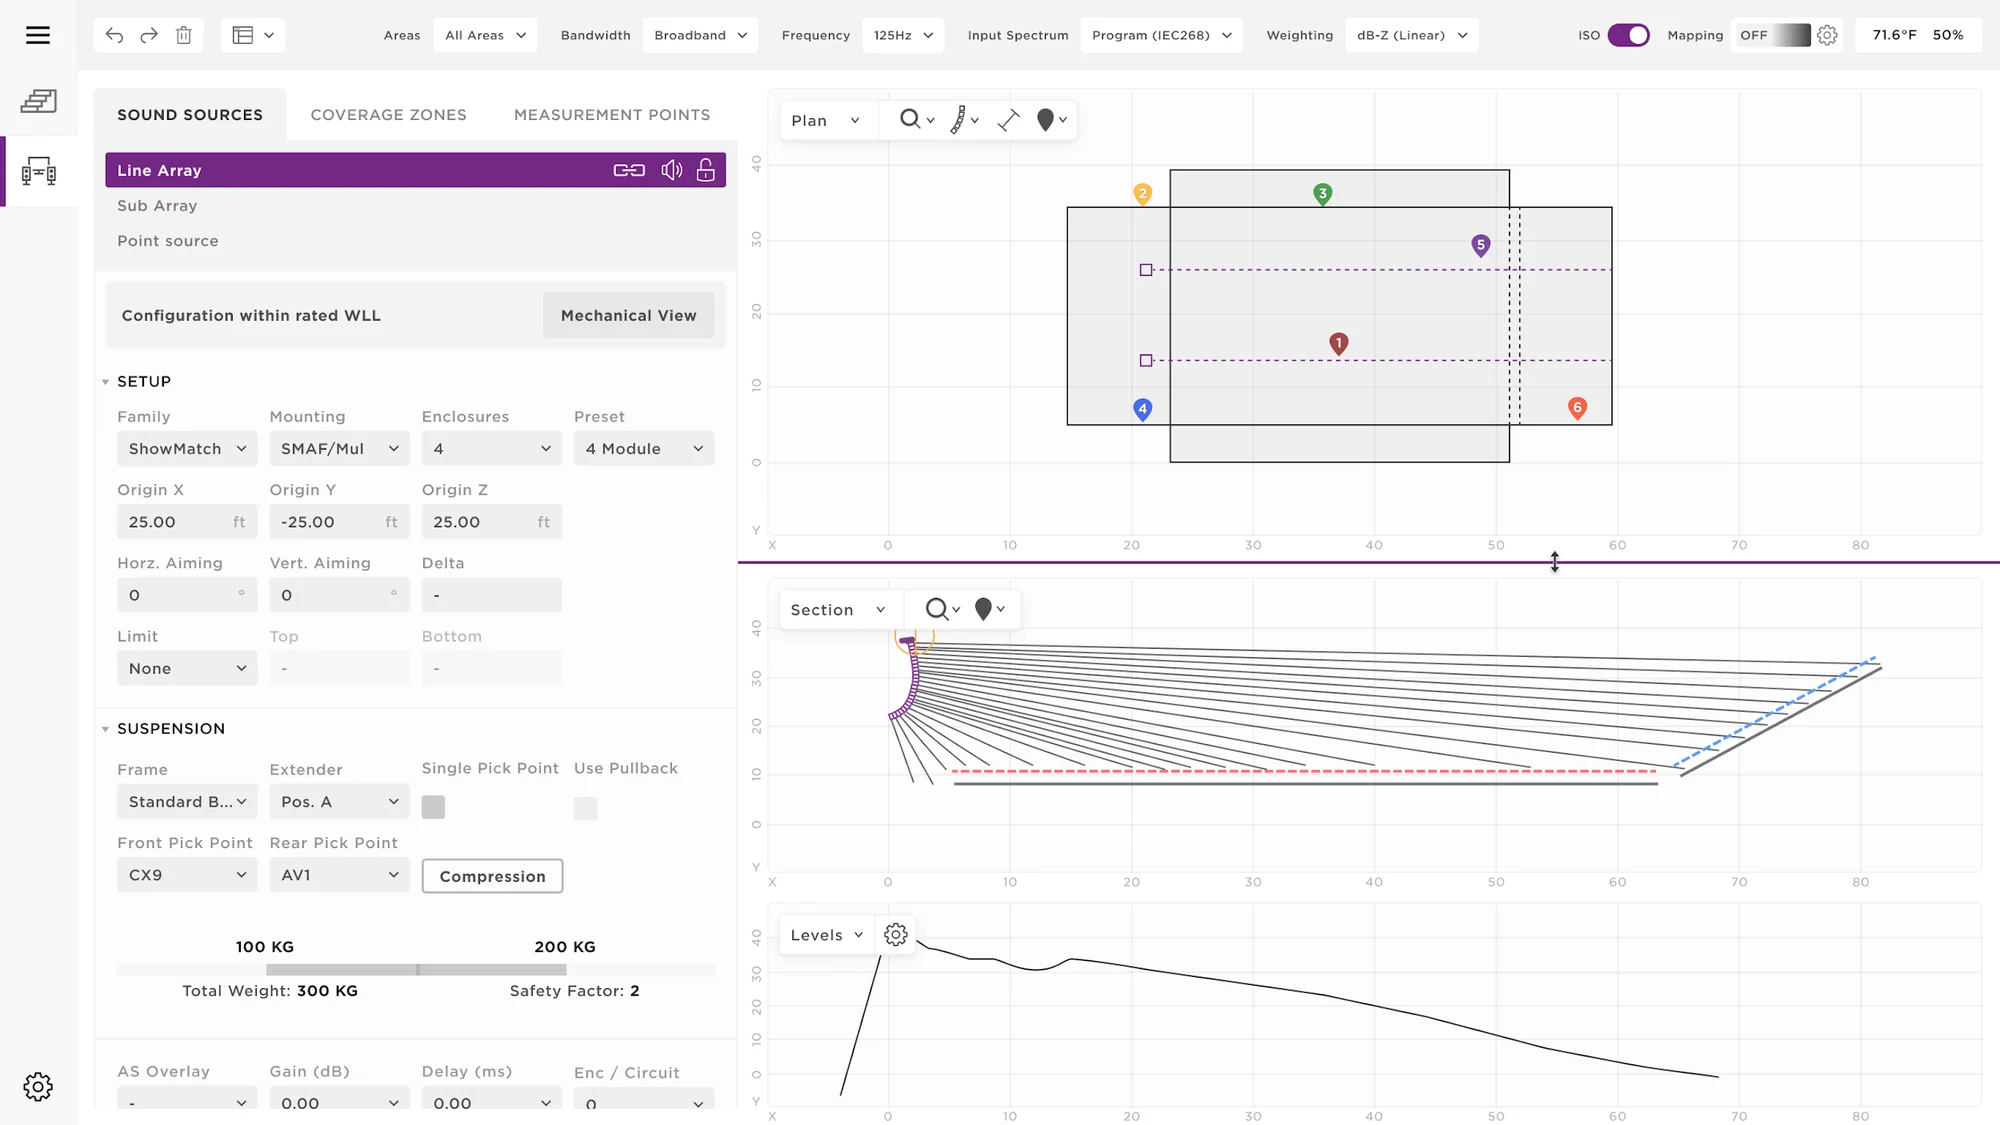
The mode shown here is System Design. The user switches between coverage zones and the software remaps the correlating sound levels in dB. One screen holds the array properties, the plan, the section, and the levels-over-distance panes at once, so a designer can reason about the whole field in one place.
Model coverage by zone
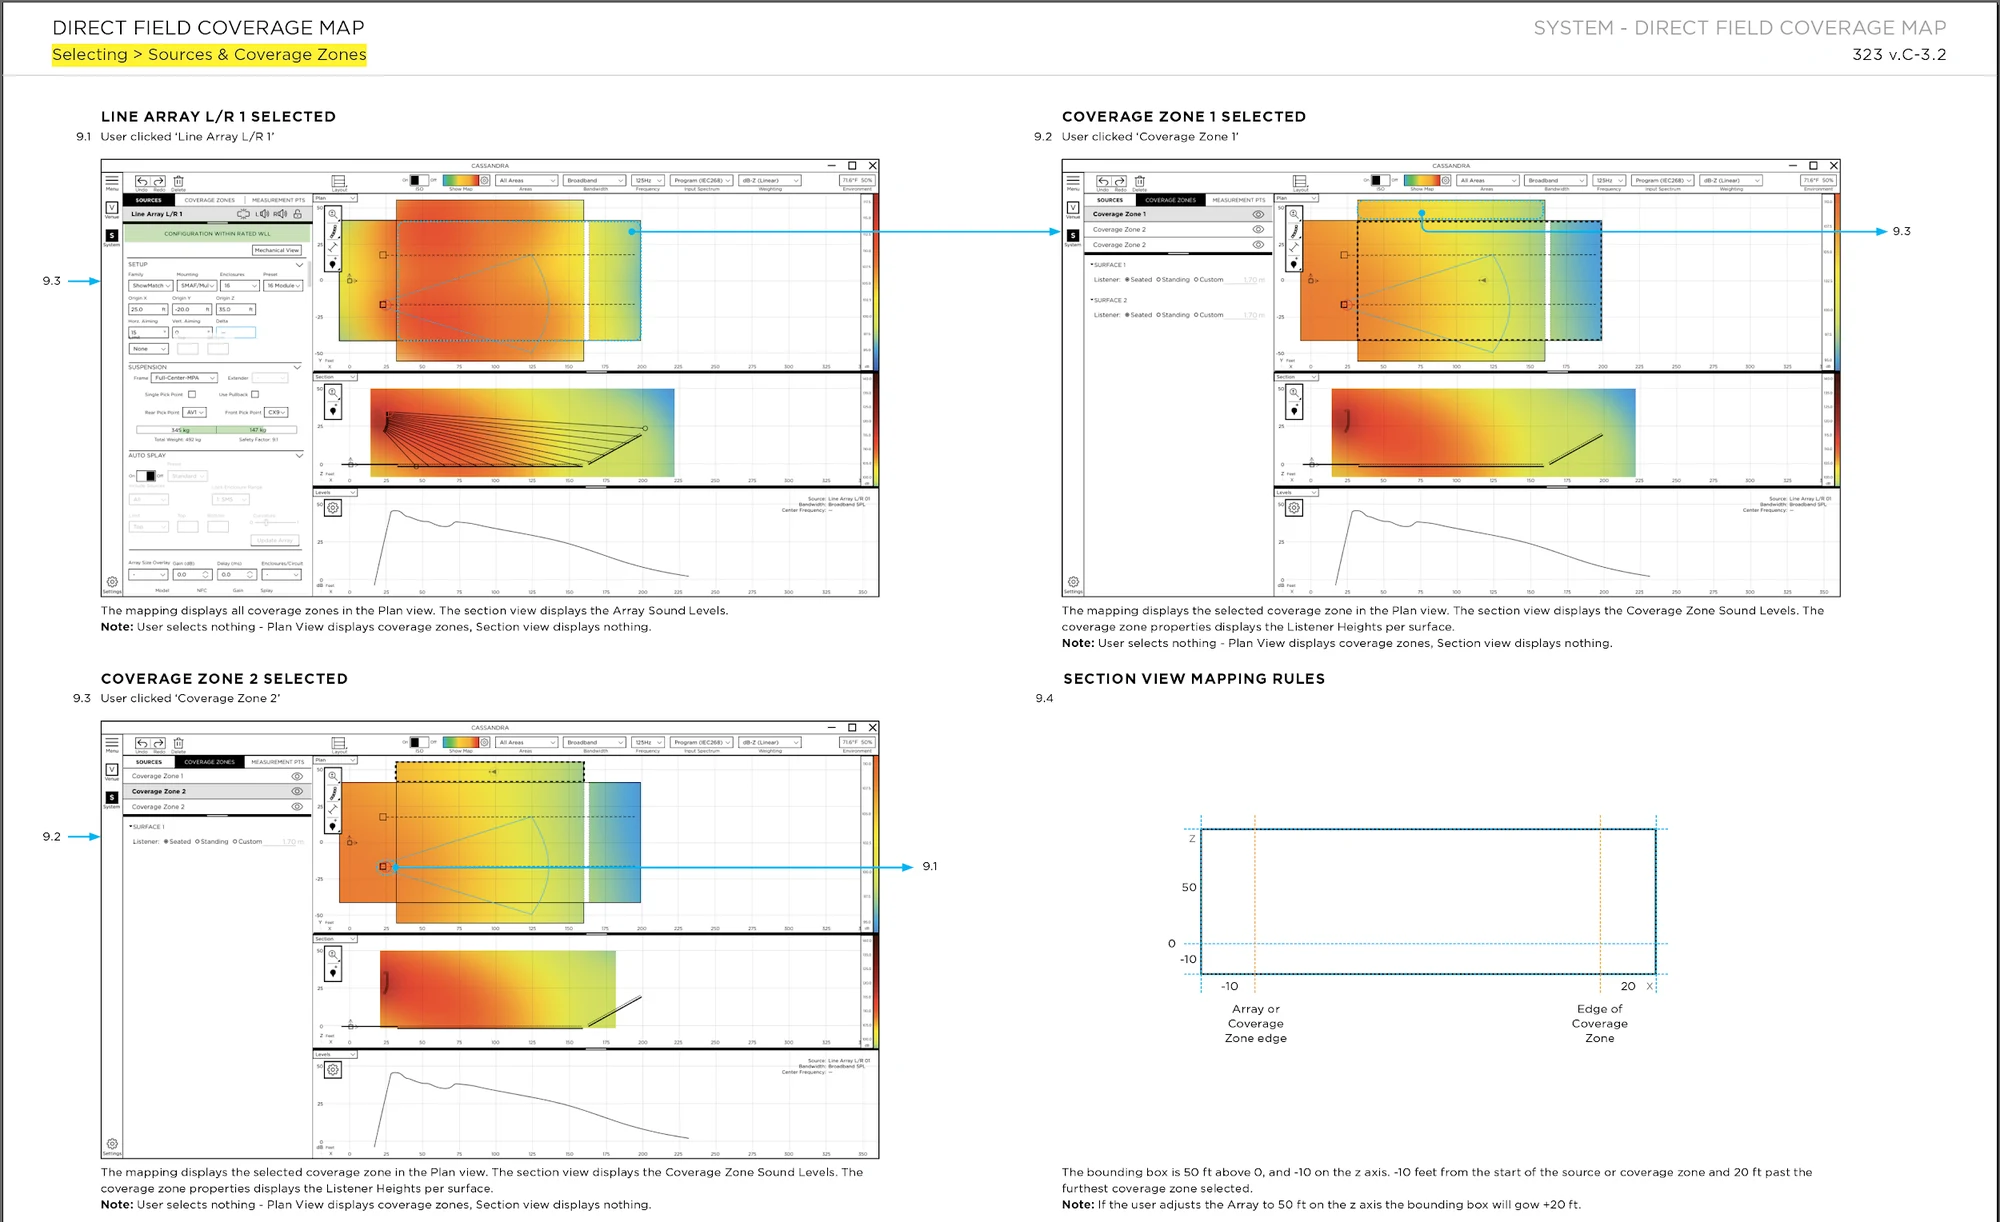
Selecting an array or a coverage zone redraws the plan and section heat maps and the levels-over-distance curve. The Direct Field Coverage Map specs the rules for each state, what the plan shows, what the section shows, and what happens when the user selects nothing.
Build the design system
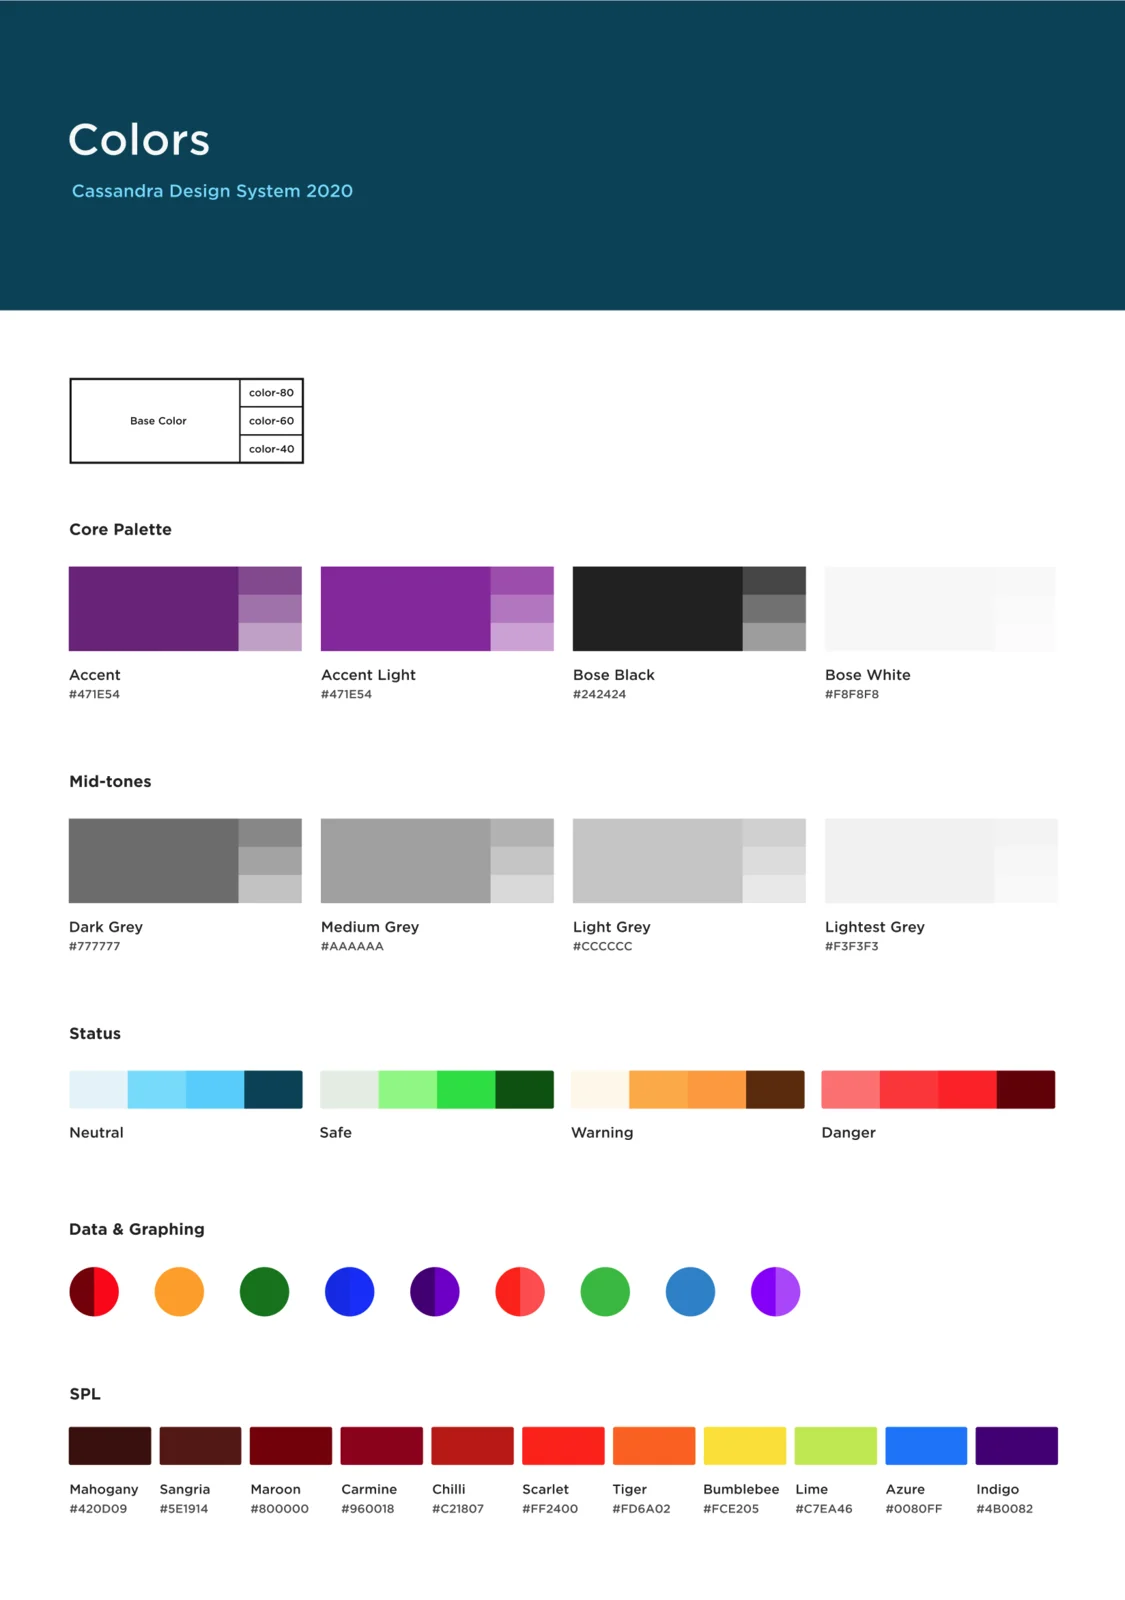
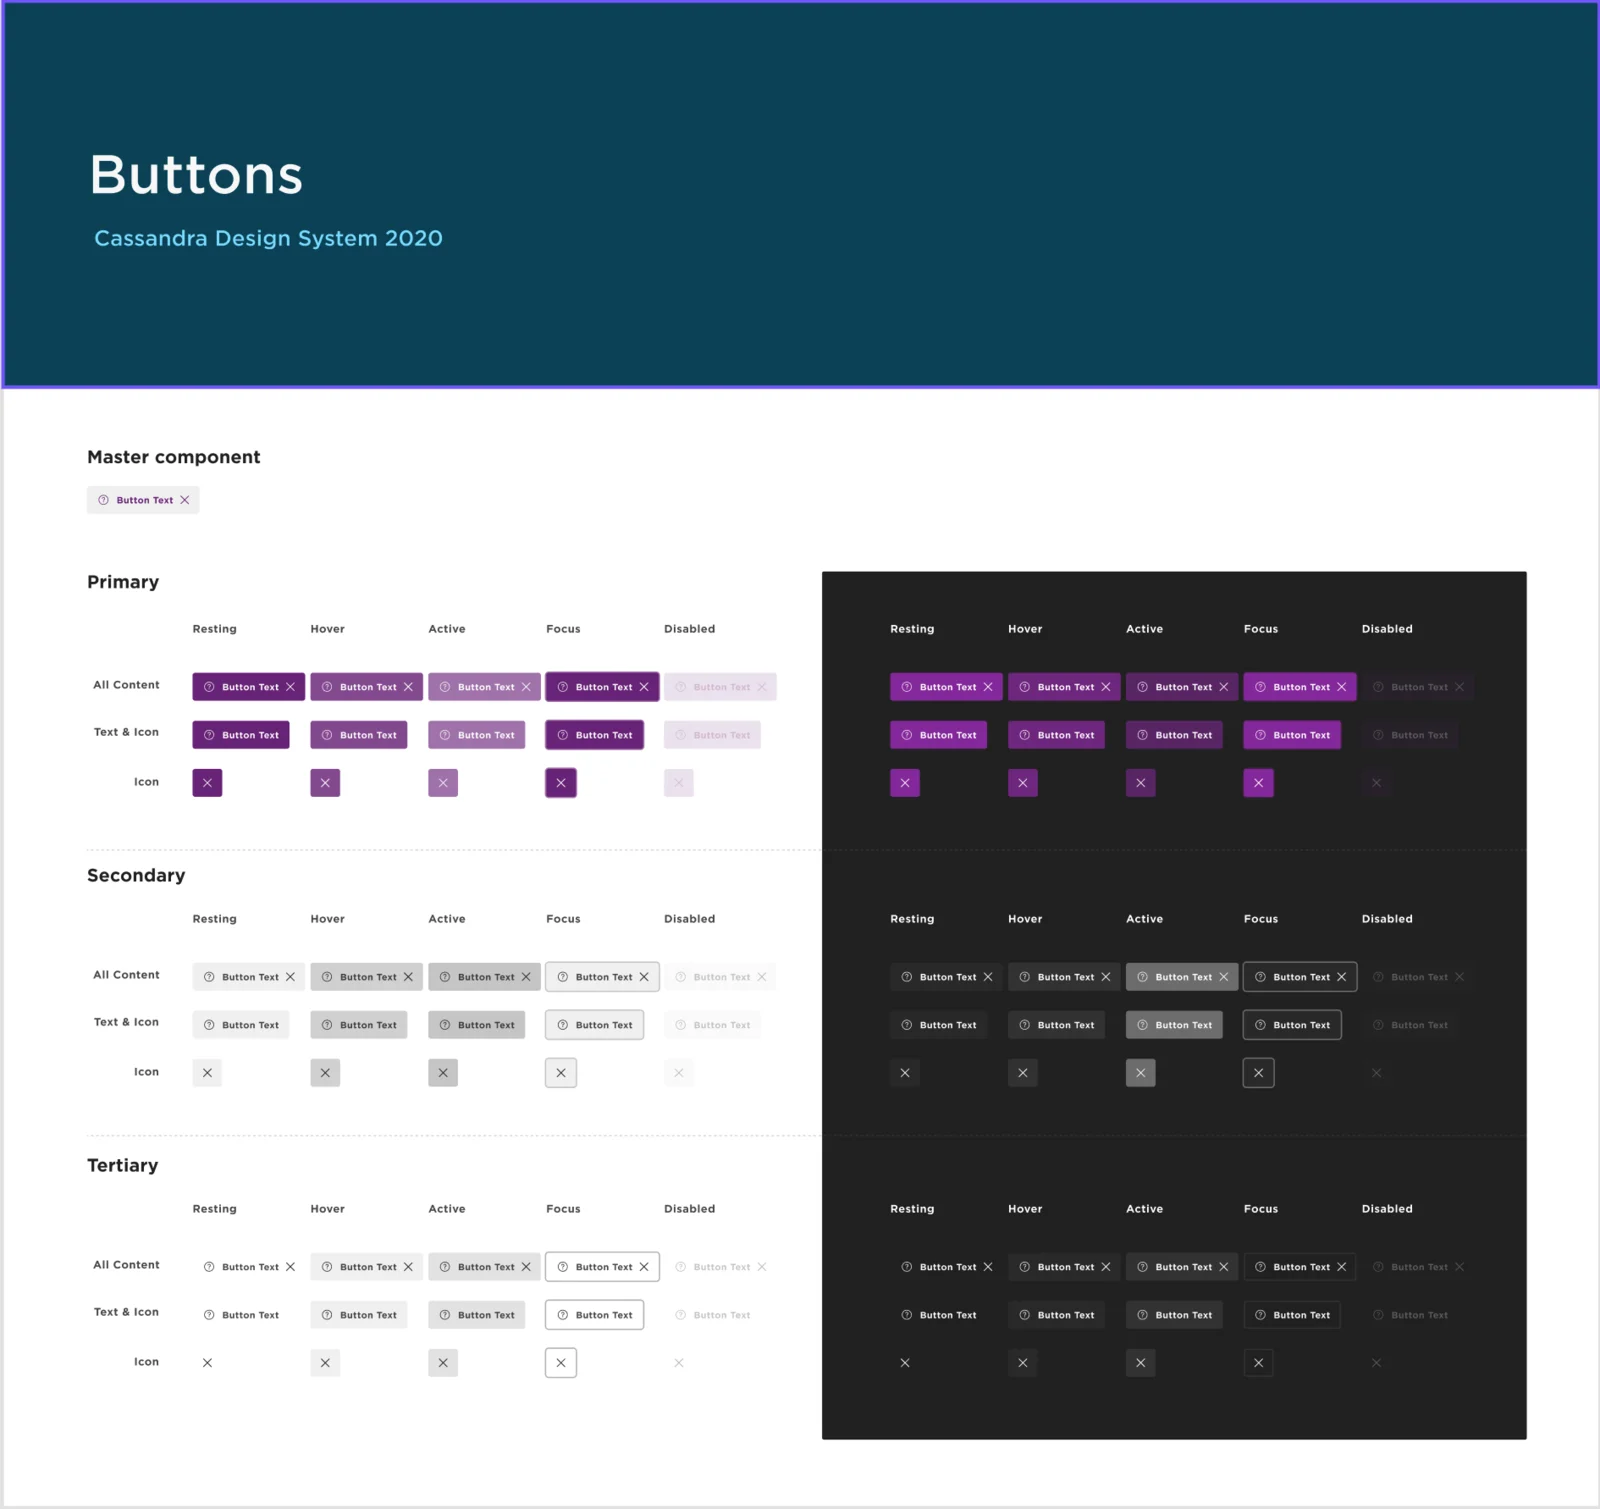
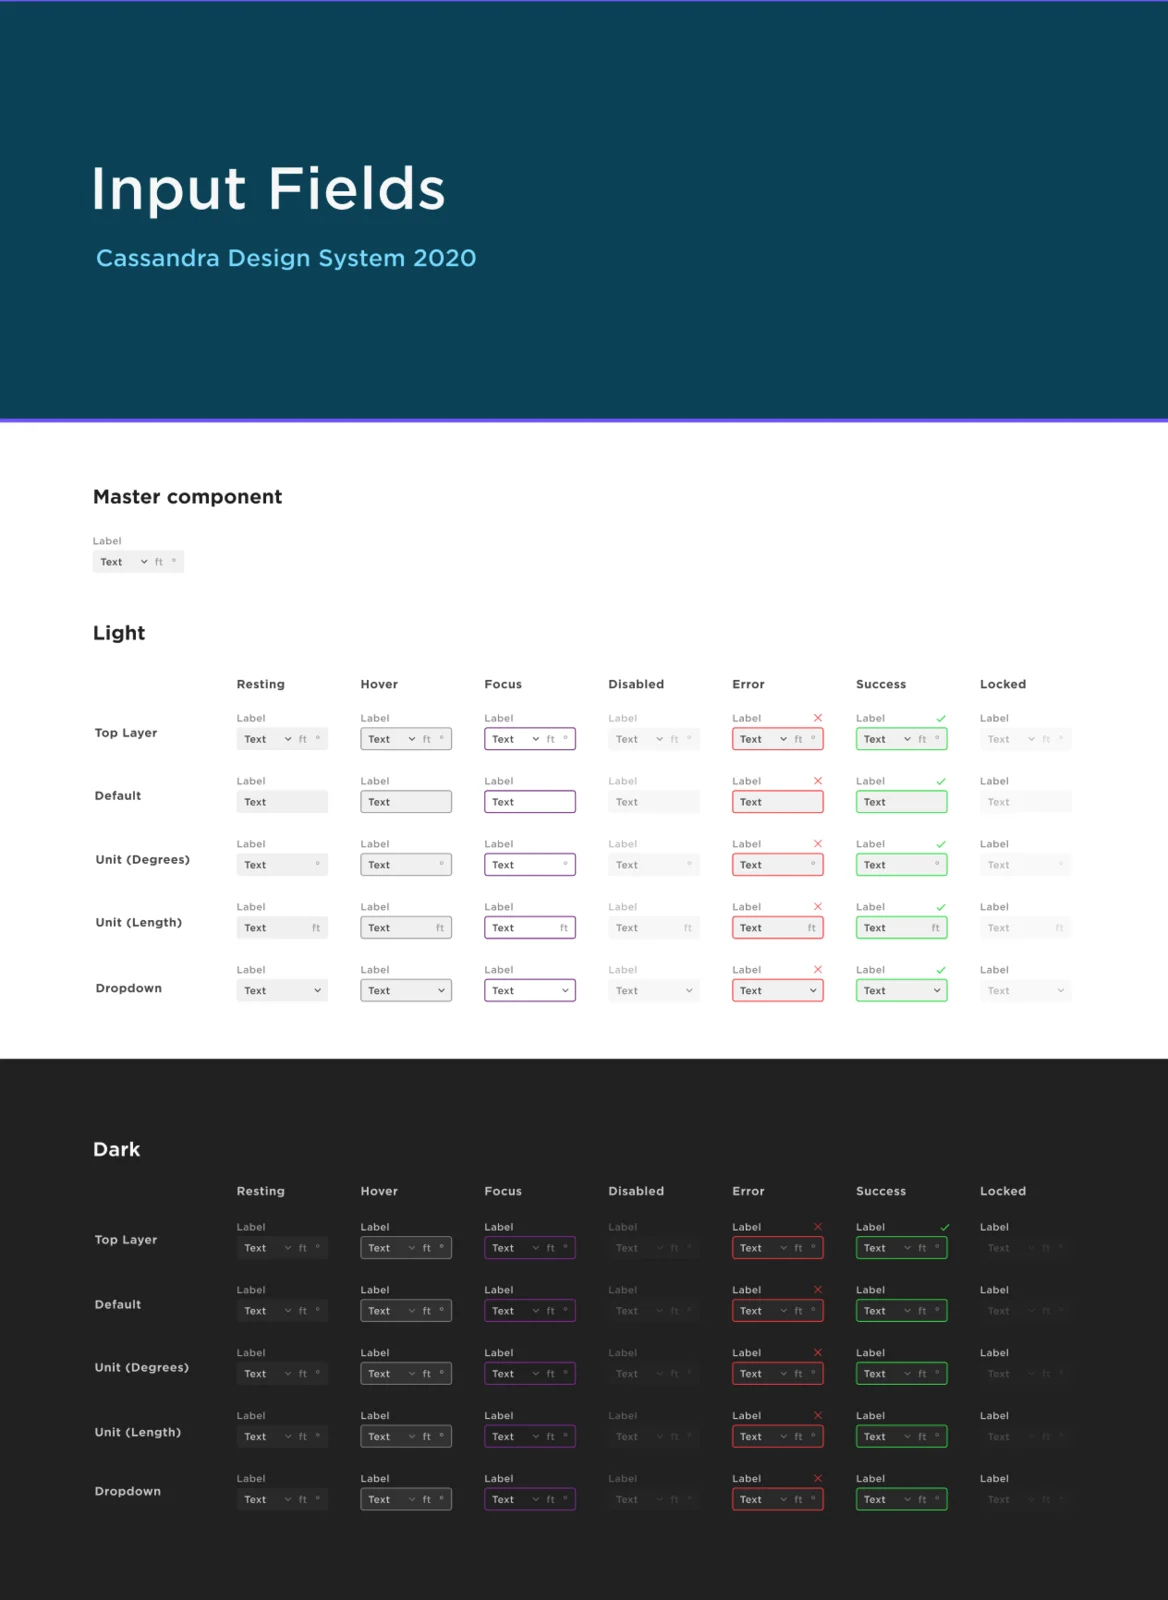
I led a team of visual designers to build Cassandra, the design system for the Professional Division. Colors, buttons, and input fields were specified as master components with light and dark variants, so the software stayed consistent as it grew.
Research and iterate
Many hours of research, brainstorm sessions, user testing, and design iteration went into a state of the art acoustical data modeling system.
Cassandra was the design system behind the software. A small set of master components with light and dark variants, documented so the team could build from one source.
The coverage map read sound levels as color across plan and section views, so the data was visual before it was numeric.
| Component | Scope |
|---|---|
| Colors | Primary, secondary, status, light and dark |
| Buttons | Master component, every state |
| Input fields | Light and dark variants |
| Coverage map | Plan, section, levels-over-distance |
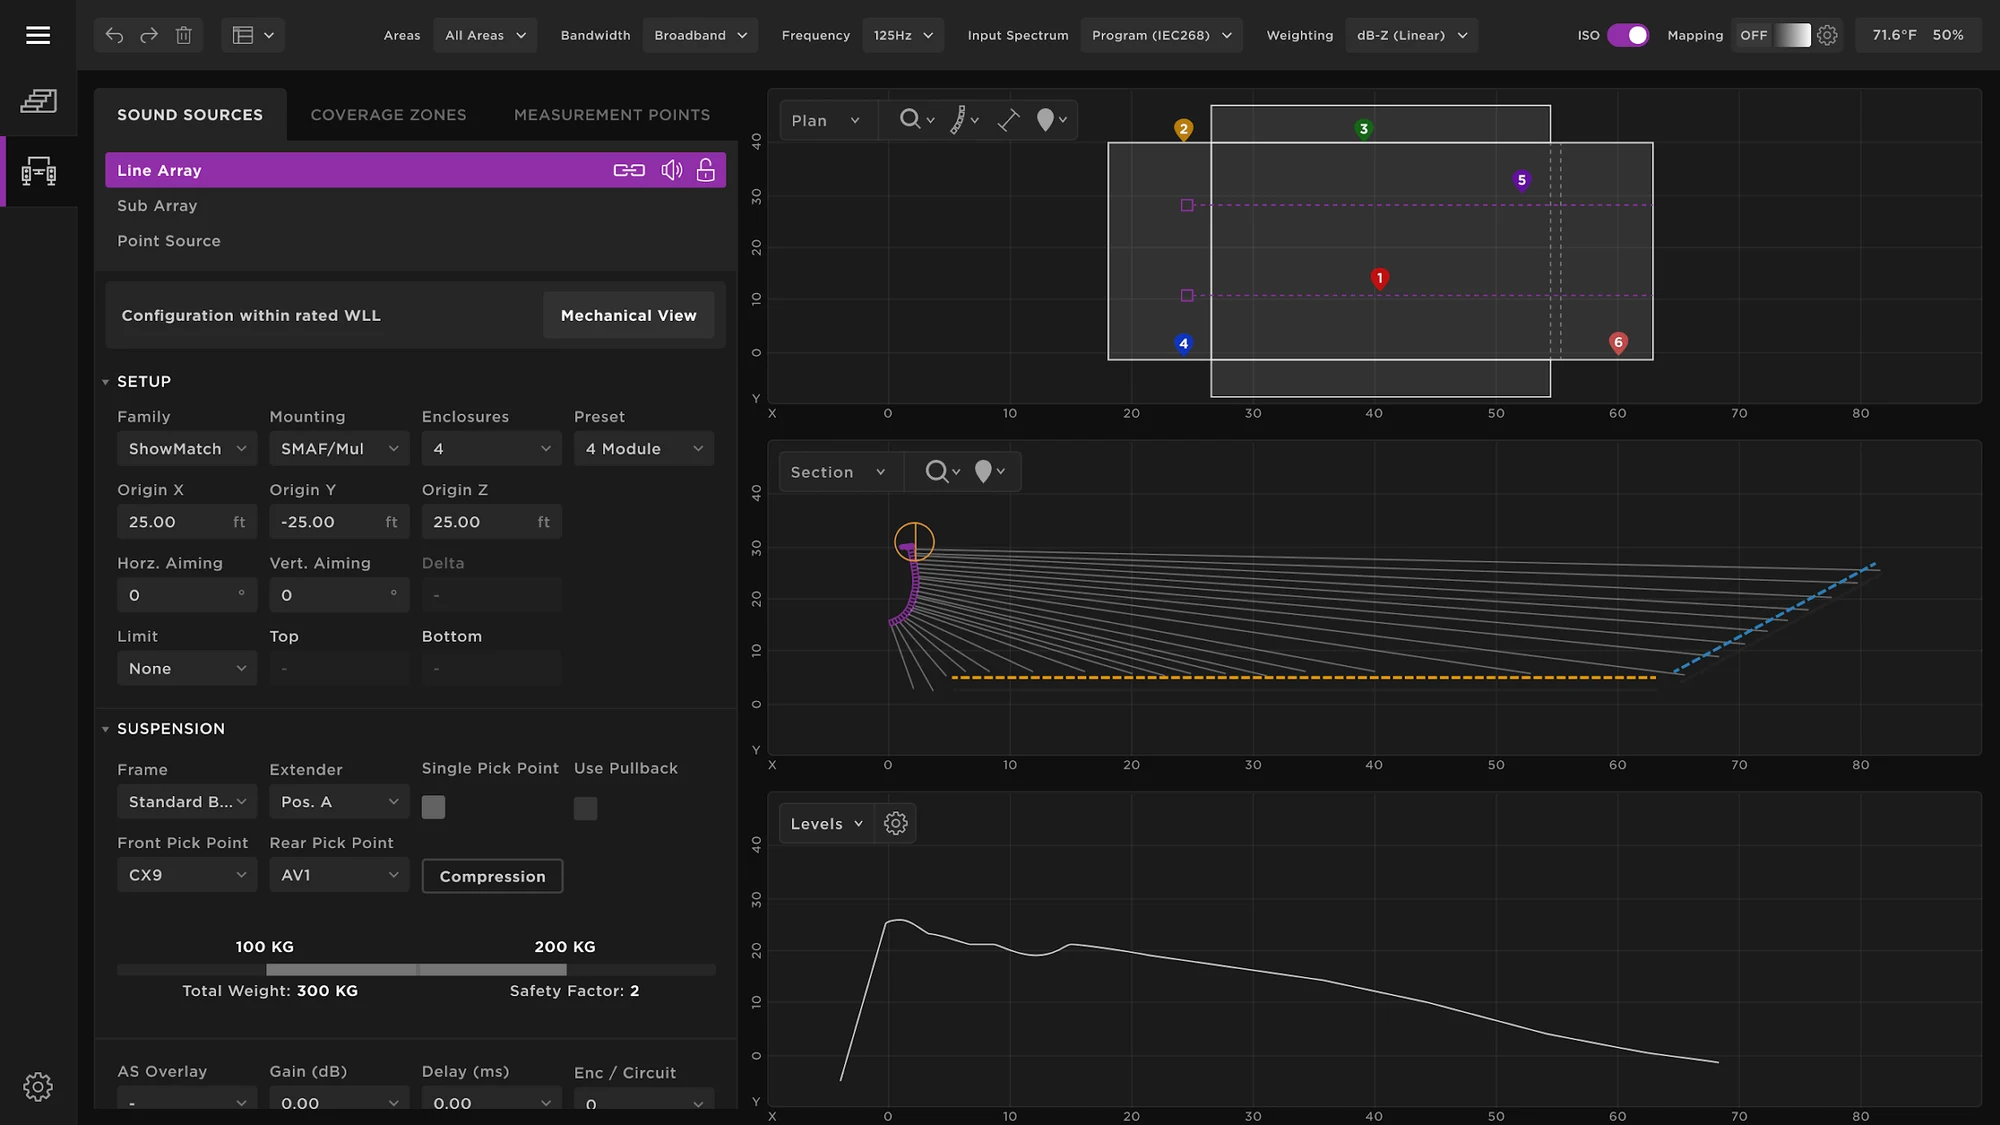
Switch a zone, remap the field
Selecting a different coverage zone remaps the plan and section heat maps and the levels curve together, so the designer sees the trade-off immediately.
Coverage map UX
The System Design mode, specified state by state across array and coverage-zone selection, in light and dark.
Cassandra design system
Colors, buttons, and input fields as documented master components for the Professional Division.
— Coverage Map
— Cassandra Design System
The goal was to make acoustical data something a designer could see and trust at a glance.
Numbers in tables
Color coverage maps in plan and section
No shared system
The Cassandra design system
One value at a time
Whole field on one screen
Then Covid shut down live music and the project was shelved. The early design carried forward elsewhere in the industry. The coverage-map UX and the Cassandra system were built and working when it stopped.
Design system built
Every component
Coverage views
Bose Professional
Built out the wireframes, UX, and UI, and the Cassandra design system for Bose Professional. The acoustical modeling itself was a team effort with Bose's sound designers.
Otto Home Robot
Want something like this?
Start a conversation→